Give feedback Report a problem
Neighbourhood in OosterhoutVrachelen-Noord
Noord-Brabant›Oosterhout›Vrachelen›Vrachelen-Noord
Vrachelen-Noord has 2,615 residentsMost are 45 to 65 years old
There are 1,111 homes in Vrachelen-NoordCurrently there are 21 for sale and 1 for rent
Energy label A is the most common in Vrachelen-NoordBased on registered homes

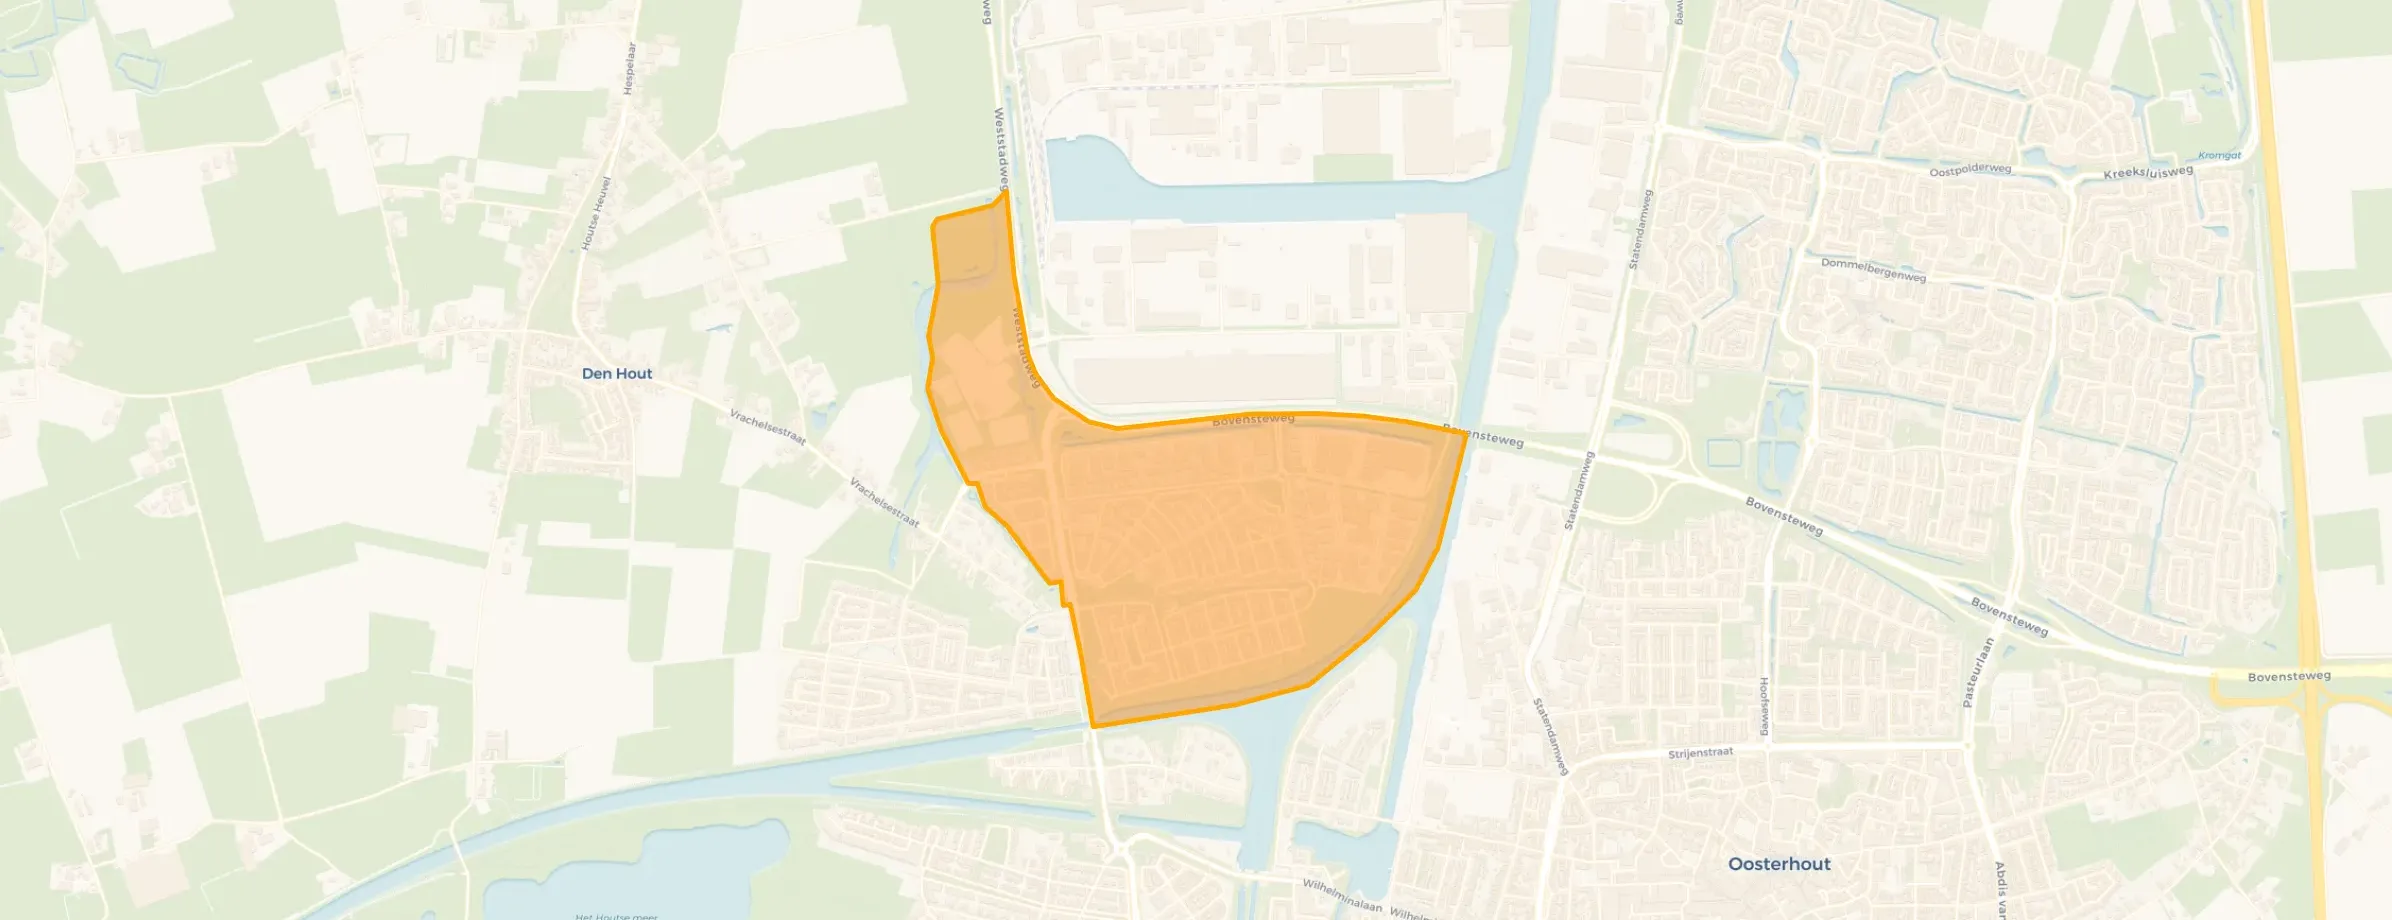
Vrachelen-Noord is located in the province of Noord-Brabant, in the municipality of Oosterhout, in the district Vrachelen. The neighbourhood has a total area of 101 hectares, of which 96 hectares are land and 5 hectares are water. The neighbourhood is coded as BU08260701. The postcode area is 4906BA-4906ML.

Residents

Vrachelen-Noord has 2.615 residents. Of these, 48,8% are men and 51,2% are women. Most residents are 45 to 65 years (31,7%). The other age groups are 22,0% for '25 to 45 years', 18,4% for '65 years or older', 16,6% for '0 to 15 years' and 11,1% for '15 to 25 years'. Of the residents, 44,9% is unmarried, 43,2% is married, 7,1% is divorced and 4,8% is widowed. 2.145 residents originate from the Netherlands, 165 come from Europe and 300 come from countries outside Europe.

There are 1.120 households in Vrachelen-Noord. 26,8% of these are single-person households, 34,4% households without children and 38,8% households with children. The average household size is 2,3 persons. The national average is 2,1 persons.

In Vrachelen-Noord there are 2.100 income recipients. The average income per income recipient is €45.500, which is €3.300 (8%) higher than the national average of €42.200. Per resident, the average income is €38.700, which is €3.800 (11%) higher than the national average of €34.900. Most residents of Vrachelen-Noord are educated to an intermediate level. 42,7% have an intermediate education (HAVO, VWO or MBO 2-4), 35,9% have a university or higher professional education (HBO/WO) and 21,4% have a lower education (VMBO or MBO 1).

Of the 2.615 residents, around 79% are in paid employment, which amounts to 2.066 people. This is 7% higher than the national average of 72%. The majority of workers are in salaried employment (85%), while 15% are self-employed. In Vrachelen-Noord, 22% of residents receive a benefit. The largest group is those receiving a state pension (AOW). 420 people receive this benefit.

Housing

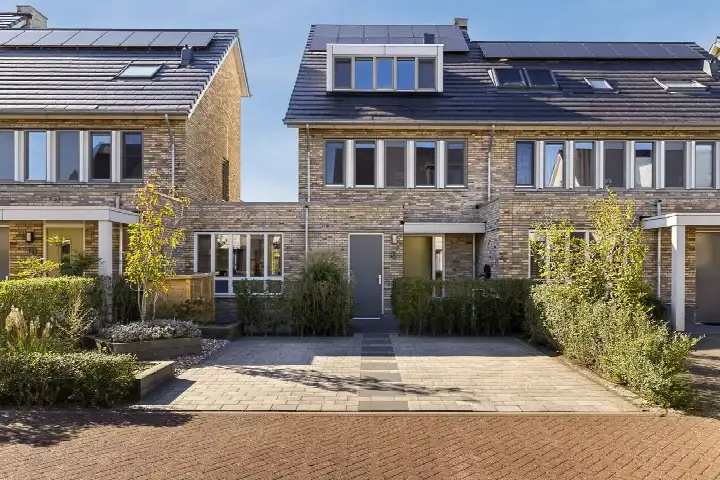
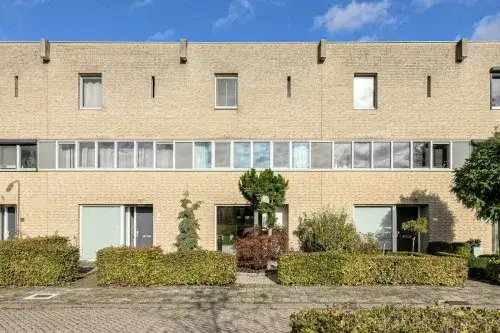
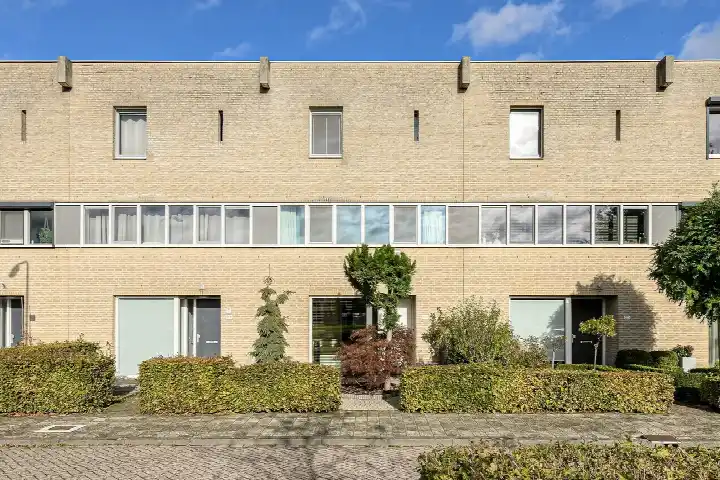
In Vrachelen-Noord there are 1.111 homes with an average assessed value (WOZ) of €430.000. Of these, around 98% are occupied and 2% unoccupied. Most homes are owner-occupied. This amounts to 28% rental homes and 72% owner-occupied homes. Of the homes, 72% privately owned, 19% owned by housing associations and 9% owned by other landlords. The most common construction periods in Vrachelen-Noord are 1990-2000 (61%) and 2000-2010 (29%).

Homes for sale in Vrachelen-Noord

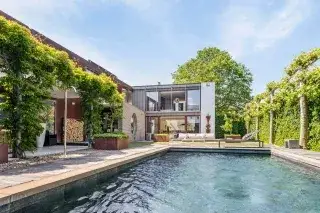
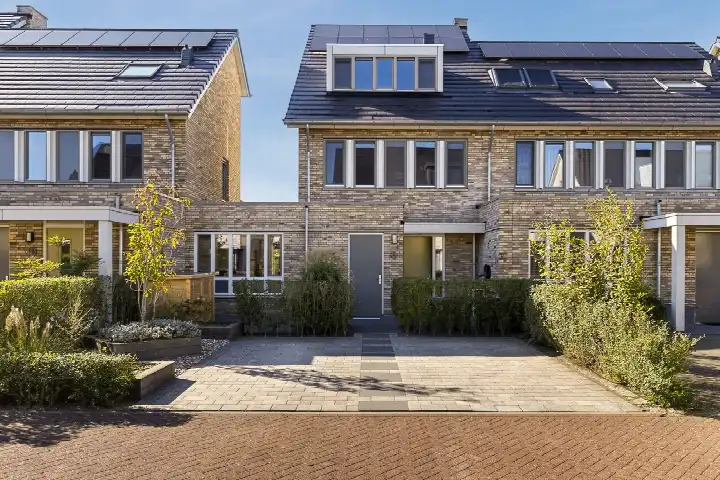
There are currently 21 homes for sale in Vrachelen-Noord. The most recently listed home is Stuifduin 8 by Van de Water Makelaars Tilburg. Over the past year, 44 homes were sold in Vrachelen-Noord. On average, a home was sold within 59 days.

The average asking price for a home for sale in Vrachelen-Noord over the past year was €647.818. This is 51% higher than the average assessed value (WOZ) of €430.000. The average asking price per m² of floor area is €4.302.

Rental homes in Vrachelen-Noord

There is 1 homes for rent in Vrachelen-Noord. The most recent home is Max Havelaardreef 132, offered by vb&t Verhuurmakelaars. Over the past year, 5 homes were let in Vrachelen-Noord. On average, a listing was let within 13 days.

The average rent for a rental home in Vrachelen-Noord over the past year was €1.341 per month. Per m² of floor area that is €11 per month.

Energy

In Vrachelen-Noord there are 856 addresses with a registered energy label. The most common labels are A (57%), B (29%) and C (6%). On average, an address in Vrachelen-Noord uses 2.860 kWh of electricity per year. This is 12% above the national average of 2.550 kWh. With an annual consumption of 730 m³ per address, natural gas consumption is 9% below the national average of 800 m³.

Street names

  • Joachim Stillerstraat
  • Reinaertstraat
  • Henri Osewoudtstraat
  • Mariken van Nimwegenstraat
  • Heideven
  • Pieter Stastokstraat
  • Doctor Vlimmenstraat
  • Woutertje Pietersestraat
  • De Waard
  • Bovensteweg
  • Frans Laarmansstraat
  • Victor Slingelandstraat
  • Elckerlycplein
  • Léonie van Oudyckstraat
  • Energieweg
  • Erik Pinksterblomstraat
  • Ina Dammanstraat
  • Esmoreitstraat
  • Anton Wachterstraat
  • Pieter Basstraat
  • Krombraak
  • Merijntje Gijzenstraat
  • Jachtkamp
  • Burgemeester Huijbregts-Schiedonlaan
  • Frits van Egtersstraat
  • Leempad
  • Sara Burgerhartstraat
  • Heer Halewijnstraat
  • Tijl Uilenspiegelstraat
  • Maria Lécinastraat
  • Weststadweg
  • Max Havelaardreef
  • De Kreek
  • Thijs Glorieusstraat
  • Leopold Sondagstraat
  • De Boedingen
  • Pallieterplein
  • Ferdinand Huyckstraat
  • Eline Verelaan
  • Vrachelsestraat
  • Broekbos
  • Elegaststraat
  • Het Goorke
  • Veldeind
  • Heijligerweg
  • Stuifduin
  • Gijsbreght van Amstelstraat
  • De Wetering

Amenities

GP
0,6 km
Pharmacy
3,3 km
Hospital
3,3 km
Supermarket
1,1 km
Railway station
10,7 km
Day nursery
0,6 km
Primary school
0,6 km
Secondary school
2,3 km
Rate Vrachelen-Noord

Share your opinion and help improve the neighbourhood.

  • Takes less than 2 minutes
  • Help home seekers
  • Improve your neighbourhood
Write a review
–
Vrachelen-Noord has no ratings yet
Ratings can be submitted via the button below
Write a review
Safety
Housing
Cleanliness
Amenities
Education
Community
Greenery
Accessibility

Statistics about the residents

Ages

Residents per age category

Household composition

Households per category
300Single-person households
385Households without children
435Households with children

Gender

Residents by gender
Men
Women

Marital status

Residents by marital status
Married
Unmarried
Divorced
Widowed

Origin

Residents per category of origin
Netherlands
Europe
Outside Europe

Work & income

Labour participation and average income
€38,700 P.A.average per resident11% above the national average
€45,500 P.A.average per income recipient8% above the national average
85%of the employed are in paid employment
15%of the employed are self-employed
79%
of the residents are employed
72%
is the national average

Education level

Residents per education level
VMBO, MBO 1
HAVO/VWO, MBO 2-4
HBO/WO

Wealth

Median wealth per household
Vrachelen-Noord
Netherlands

Benefits

Residents per benefit type
Social assistance
Disability
Unemployment

Housing market in Vrachelen-Noord

Sale price · Q4 2026
€751.750
average▲ 12,2%
€890.000
median▲ 69,5%
8 sales · vs. Q3 2026
€/m² for sale · Q4 2026
€4.319
average▼ 7,8%
€4.185
median▼ 4,8%
+24% vs. national average

Sales market

Market speed and dynamics, last 12 months
59 days ▲ 86,8%
average time listed · vs. last year
44
sales in the past year
149 m²
average living area
+24%
more expensive than the national average

Rental market

Market speed and dynamics, last 12 months
13 days ▲ 91,4%
average time listed · vs. last year
5
lettings in the past year
119 m²
average living area
-28%
cheaper than the national average

Year built

Age of the housing stock

Energy labels

Sustainability of the housing stock

Living area

Distribution of home sizes

Statistics about the homes

Home types

Addresses per home type

Construction periods

Addresses per construction period

Labels

Addresses per energy label

Energy consumption

Average per address, compared with the Netherlands
Natural gas (m³)
Vrachelen-Noord
730
Netherlands
800
Electricity (kWh)
Vrachelen-Noord
2.860
Netherlands
2.550

Frequently asked questions about Vrachelen-Noord

Which type of home is most common in Vrachelen-Noord?

The housing stock is relatively young — 100% dates from after 1990.

How expensive are houses in Vrachelen-Noord?

Over the past year a home for sale in Vrachelen-Noord was listed for an average of €647,818 (€4,302 per m²). That is 24% above the Dutch national average. Last quarter prices rose by 12%.

What kind of people live in Vrachelen-Noord?

Buurt Vrachelen-Noord has 2,615 residents. The largest age group is 45 to 65 years (32%). Many families: 39% of the households have children.

How energy-efficient are the homes in Vrachelen-Noord?

The housing supply in Vrachelen-Noord is remarkably efficient: 94% has an A, A+ or B label. The average natural gas consumption per household is 730 m³ per year.

What is within walking distance in Vrachelen-Noord?

From Vrachelen-Noord you can on average reach a supermarket at 1.1 km, a GP at 0.6 km, a railway station at 10.7 km, a primary school at 0.6 km (as the crow flies, source: CBS).

How many houses are on offer in Vrachelen-Noord?

Right now you will find 21 homes for sale and 1 homes for rent in Vrachelen-Noord.

Homes Rate your neighbourhood
Buurtje.nl
Buurtje.nl in the appSearch faster and respond first
Open