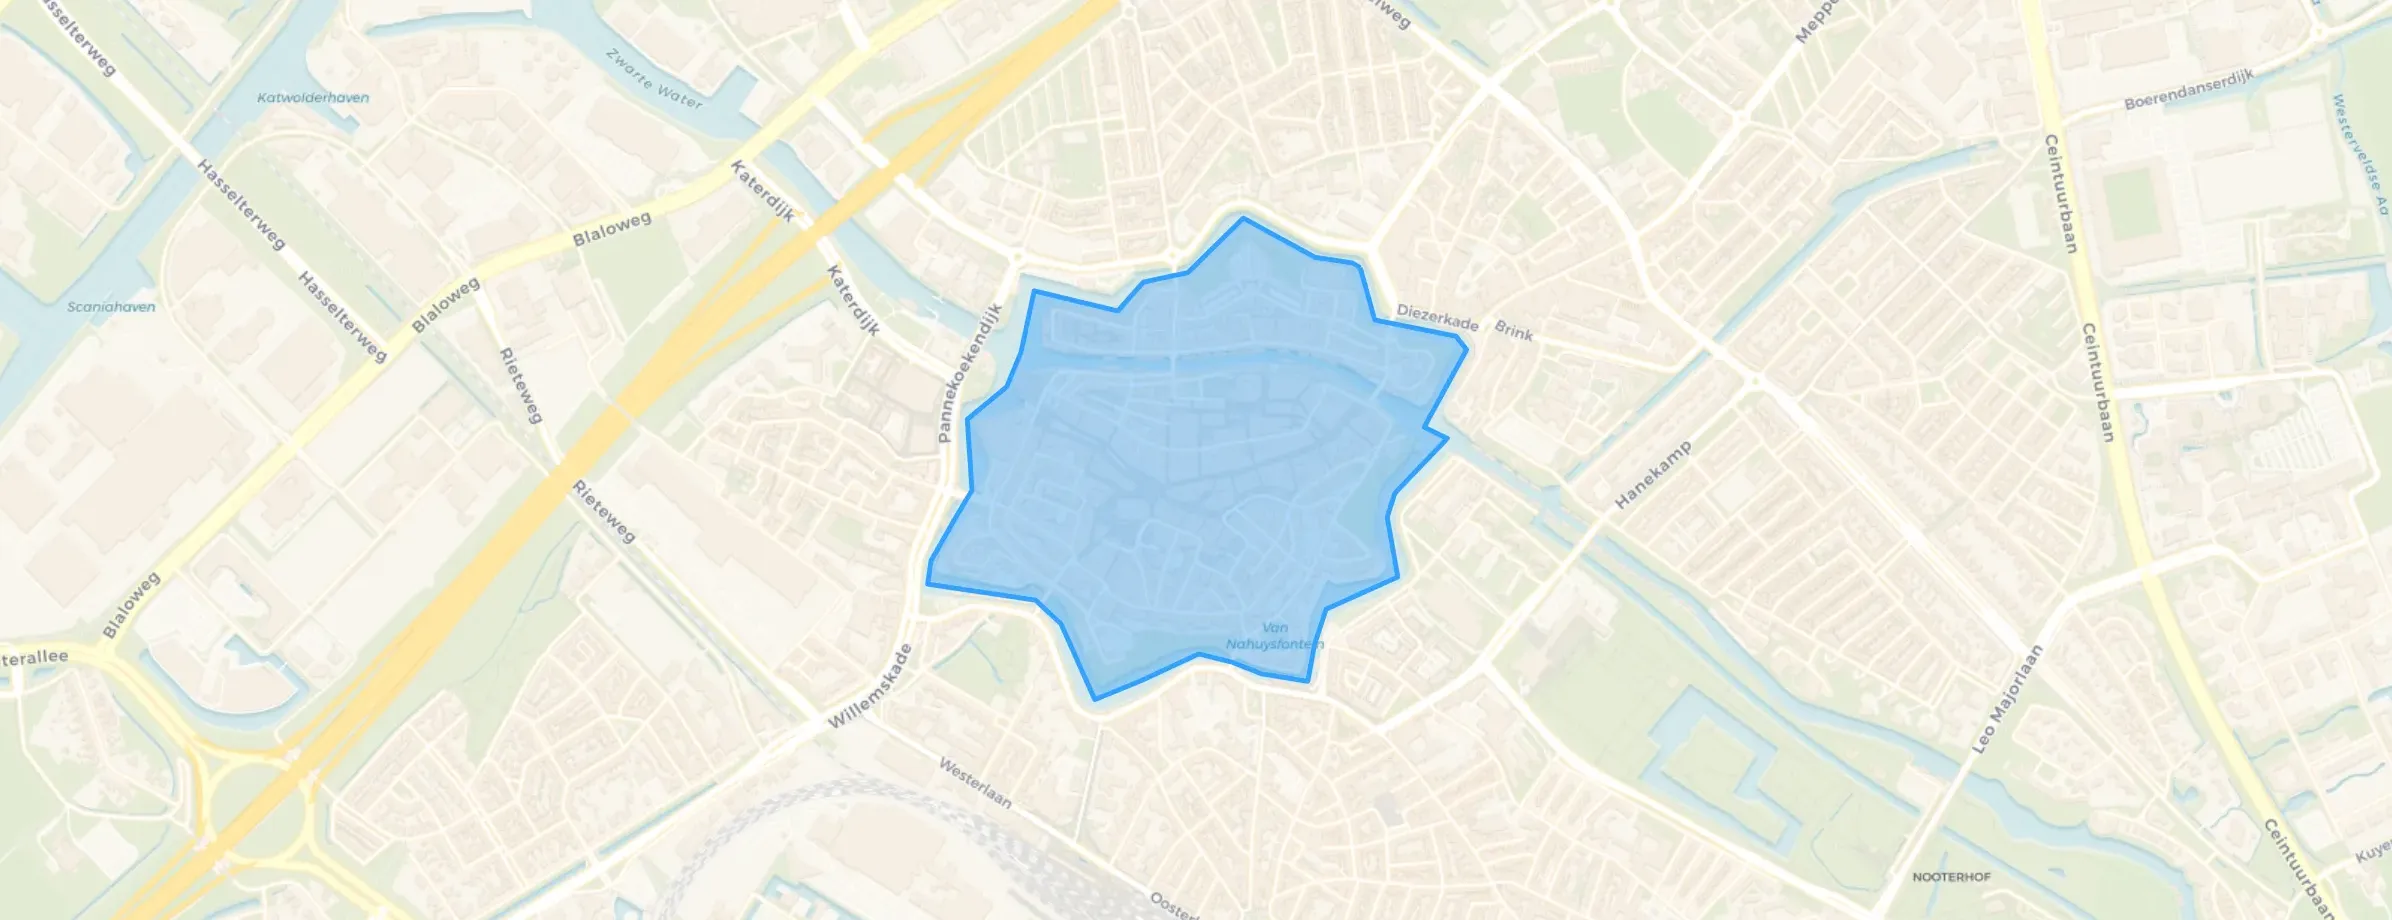
District in Zwolle
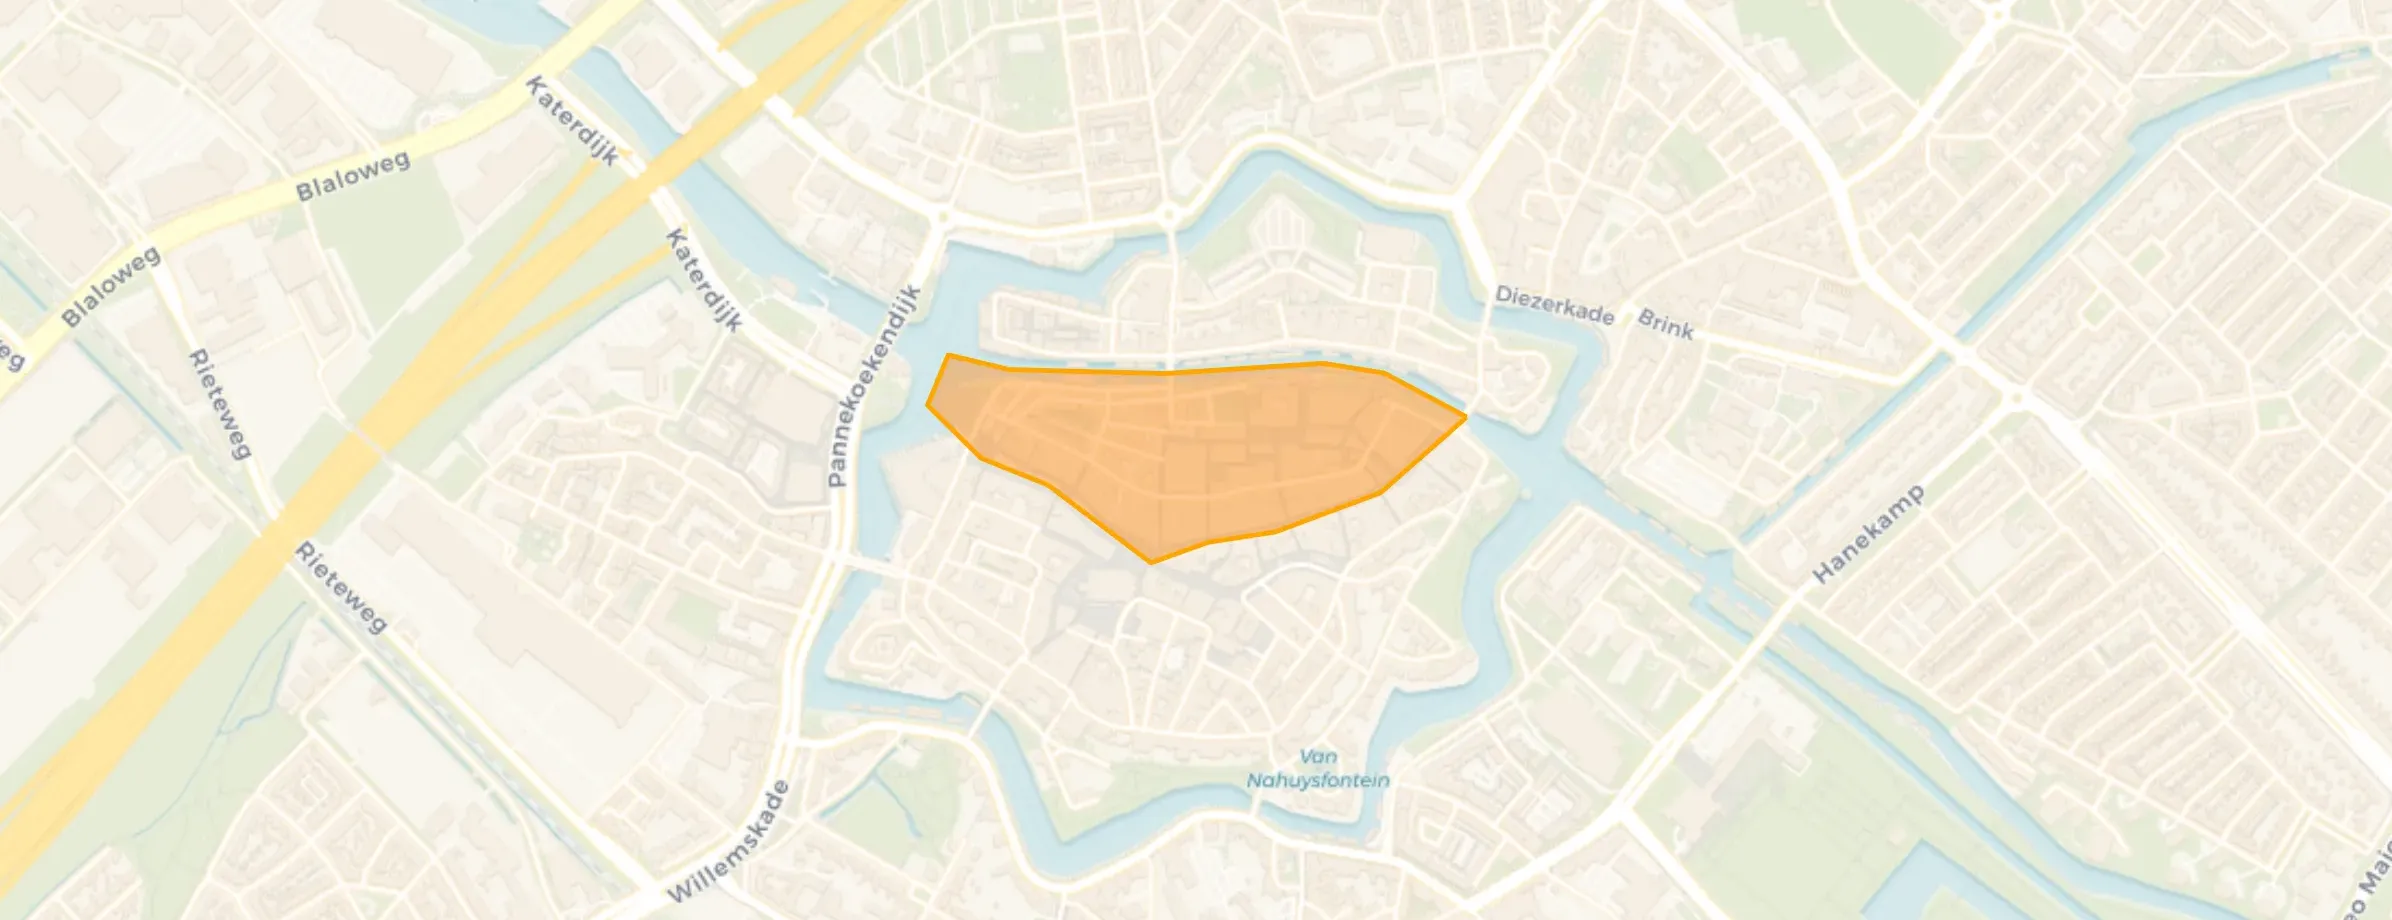
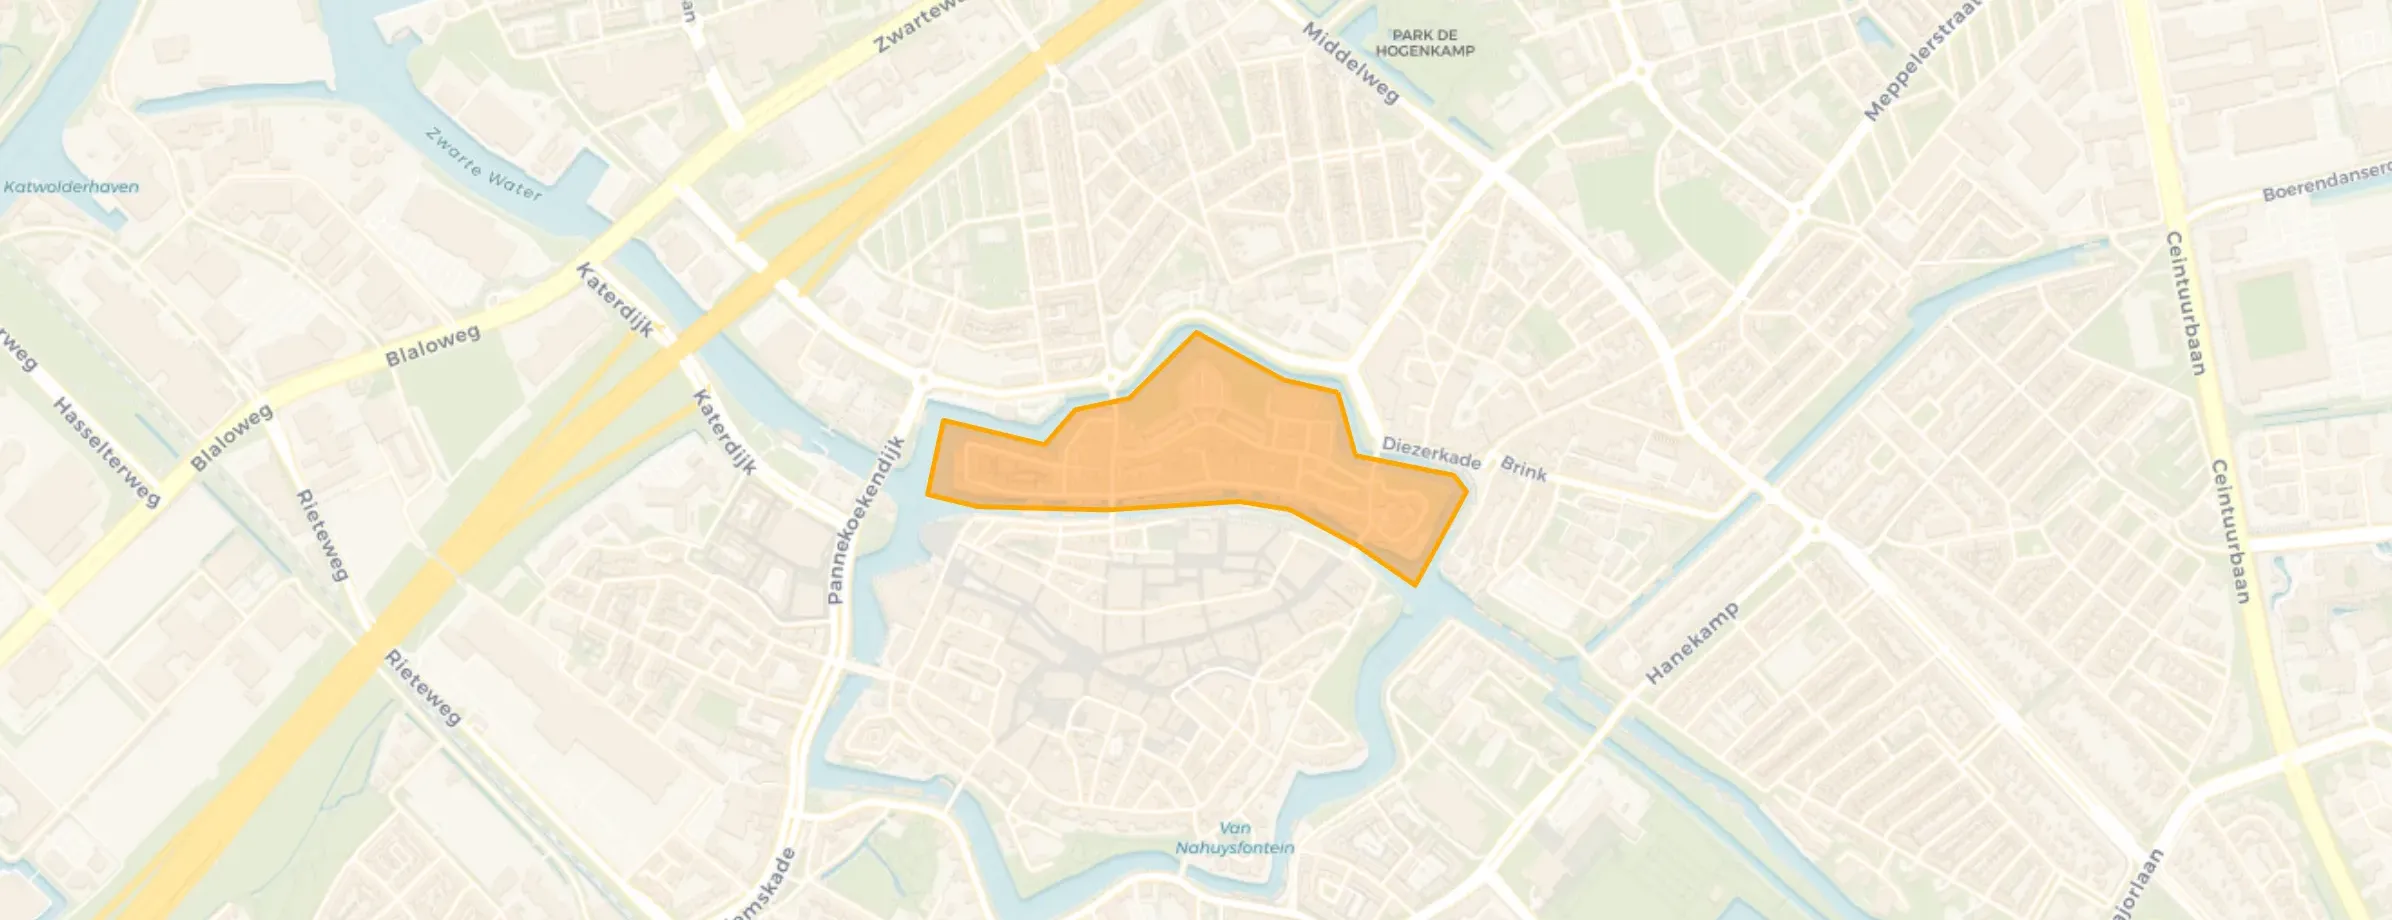
Binnenstad is located in the province of Overijssel, in the municipality of Zwolle The district has a total area of 60 hectares, of which 52 hectares are land and 8 hectares are water. The district is coded as WK019310. The postcode area is 8011LA-8011ZZ.
Binnenstad has 4.255 residents. Of these, 51,2% are men and 48,8% are women. Most residents are 25 to 45 years (45,4%). The other age groups are 19,0% for '45 to 65 years', 18,2% for '15 to 25 years', 13,7% for '65 years or older' and 3,8% for '0 to 15 years'. Of the residents, 69,6% is unmarried, 20,2% is married, 7,3% is divorced and 2,8% is widowed. 3.310 residents originate from the Netherlands, 345 come from Europe and 600 come from countries outside Europe.
There are 2.940 households in Binnenstad. 65,8% of these are single-person households, 27,0% households without children and 7,1% households with children. The average household size is 1,4 persons. The national average is 2,1 persons.
In Binnenstad there are 3.900 income recipients. The average income per income recipient is €49.800, which is €7.600 (18%) higher than the national average of €42.200. Per resident, the average income is €47.100, which is €12.200 (35%) higher than the national average of €34.900. Most residents of Binnenstad are highly educated. 52,6% have a university or higher professional education (HBO/WO), 37,4% have an intermediate education (HAVO, VWO or MBO 2-4) and 10,1% have a lower education (VMBO or MBO 1).
Of the 4.255 residents, around 80% are in paid employment, which amounts to 3.404 people. This is 8% higher than the national average of 72%. The majority of workers are in salaried employment (81%), while 19% are self-employed. In Binnenstad, 20% of residents receive a benefit. The largest group is those receiving a state pension (AOW). 530 people receive this benefit.
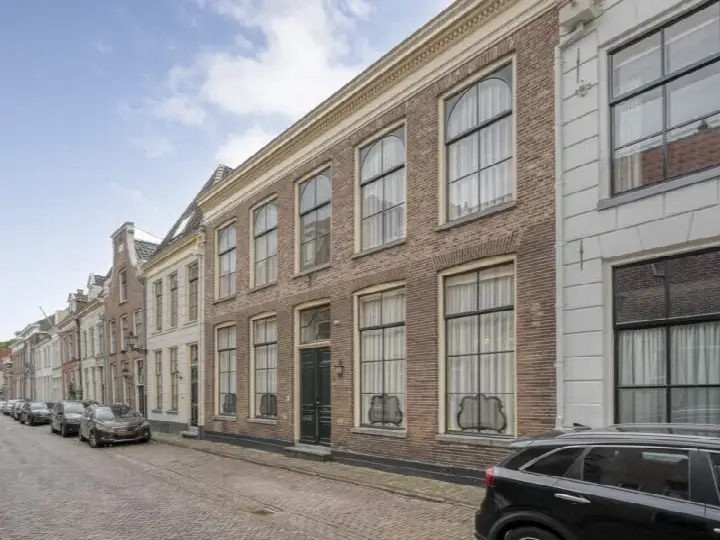
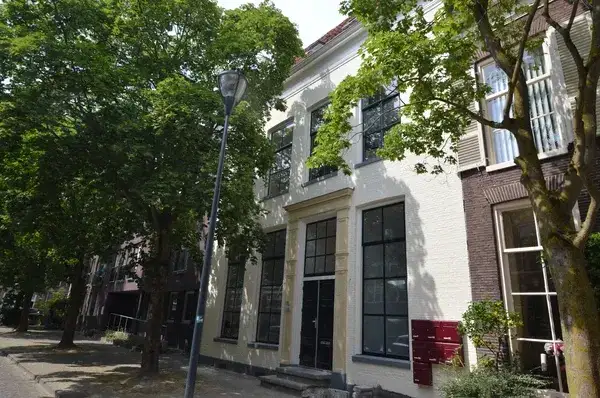
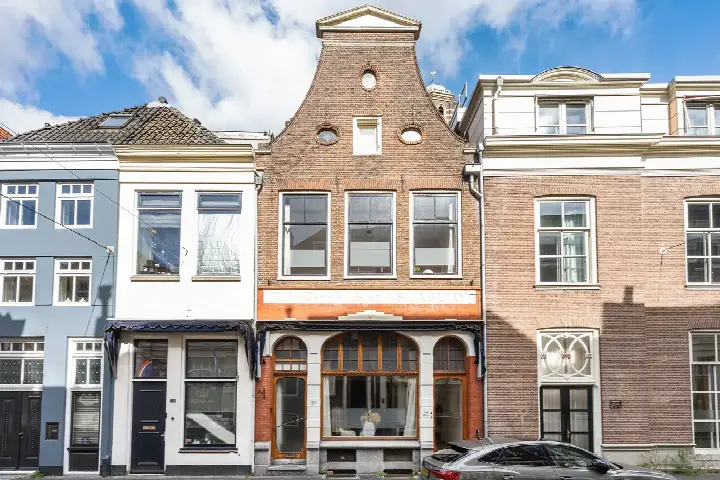
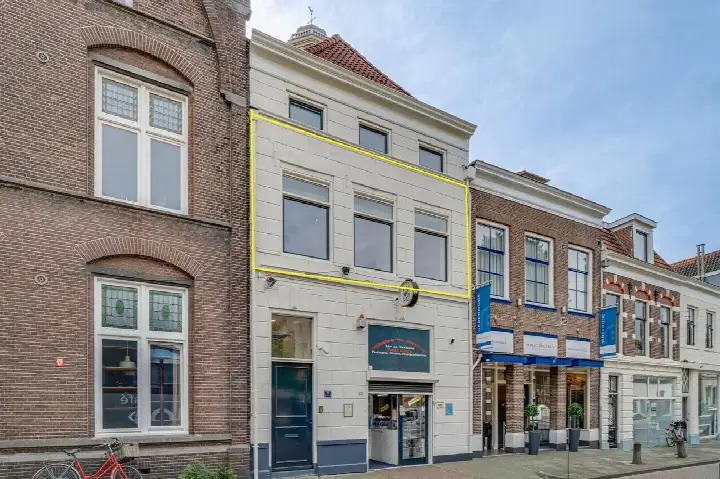
In Binnenstad there are 2.878 homes with an average assessed value (WOZ) of €372.000. Of these, around 92% are occupied and 8% unoccupied. Most homes are rental properties. This amounts to 70% rental homes and 30% owner-occupied homes. Of the homes, 30% privately owned, 19% owned by housing associations and 51% owned by other landlords. The most common construction periods in Binnenstad are 1700-1900 (31%) and 1900-1925 (13%).
There are currently no homes for sale in Binnenstad. The most recently listed home is Hagelstraat 6C by iQ Makelaars Eindhoven. No homes were sold in Binnenstad over the past year.
There are currently no homes for rent in Binnenstad. The most recent home is Oude Vismarkt 7, offered by Mijnhuurwoning.com. No homes were let in Binnenstad over the past year.
No recent rental data available for Binnenstad.
In Binnenstad there are 2.268 addresses with a registered energy label. The most common labels are A (37%), C (18%) and B (14%). On average, an address in Binnenstad uses 2.070 kWh of electricity per year. This is 19% below the national average of 2.550 kWh. With an annual consumption of 720 m³ per address, natural gas consumption is 10% below the national average of 800 m³.
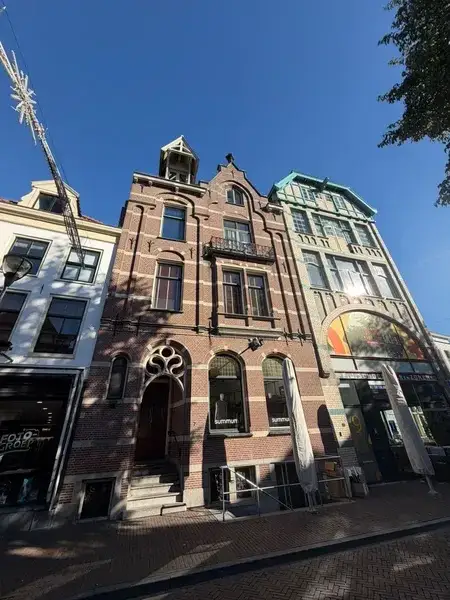
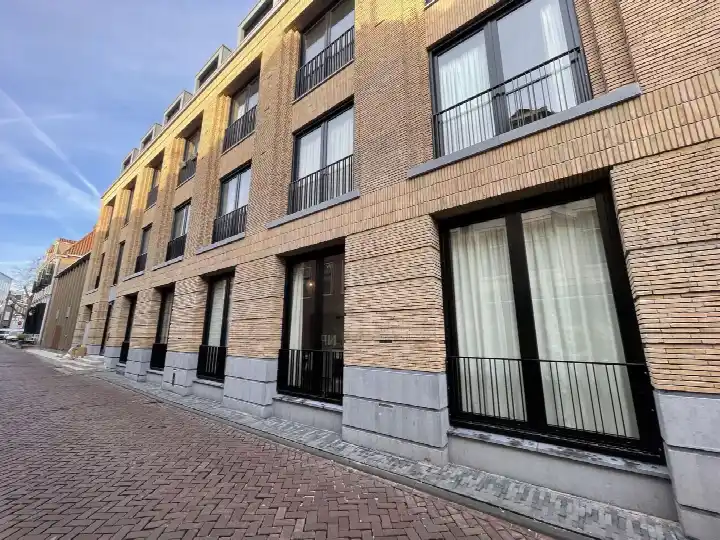
The neighbours are involved and there for each other. There is always something to do, but usually it's also quiet on the street. It remains the city centre, so on nights out or during events it can be a bit noisy, but that, in my opinion, adds charm to the neighbourhood. The streets look incredibly beautiful and it's a very green part of the city.
Auto-translated to English by AIIt's getting busier and noisier in the city centre where I live. A lot of nuisance from pub-goers, especially at the weekend. People who don't live here park their cars and bikes in the street. Lots of delivery vans and other traffic that drive into and park on the street. Lots of beeping from cars when they have to reverse back out. It's a dead-end narrow street. I'm seriously considering moving. Out of the city centre at any rate. The neighbours themselves I have little to no trouble with.
Auto-translated to English by AIThe neighbourhood is not very large, so many people know each other, and occasionally a neighbourhood day is organised. The area is reasonably safe, but at the weekend people pass through on their way to go out. There is greenery, but there is still room for improvement. There is no primary school or similar in the neighbourhood. The amenities are very extensive as the neighbourhood is located near the shopping street. There is a bus stop, so I would say it is easily accessible. Housing in the neighbourhood is not good; there are not many houses for sale, and the houses that are sometimes available to rent have high rental prices. Rents should be lower and more owner-occupied homes.
Auto-translated to English by AIThe most common type is flats (81%).
Over the past year a home for sale in Binnenstad was listed for an average of €490,564 (€5,674 per m²).
A rental home in Binnenstad cost an average of €1,348 per month (€18 per m²). That is 38% below the national average.
Residents give Binnenstad a 7.2 out of 10 based on 3 reviews. Amenities stands out with a 8.7; nature and greenery lags behind with a 5.0.
Wijk Binnenstad has 4,255 residents. The largest age group is 25 to 45 years (45%). Notably, 66% of the households are single-person households.
The housing supply in Binnenstad is remarkably efficient: 57% has an A, A+ or B label. The average natural gas consumption per household is 720 m³ per year.
From Binnenstad you can on average reach a supermarket at 0.3 km, a GP at 0.7 km, a railway station at 1.2 km, a primary school at 0.9 km (as the crow flies, source: CBS).
Right now you will find 65 homes for sale and 29 homes for rent in Binnenstad.